
 Blurt.blog
 BlurtForum
 Discord
 Video
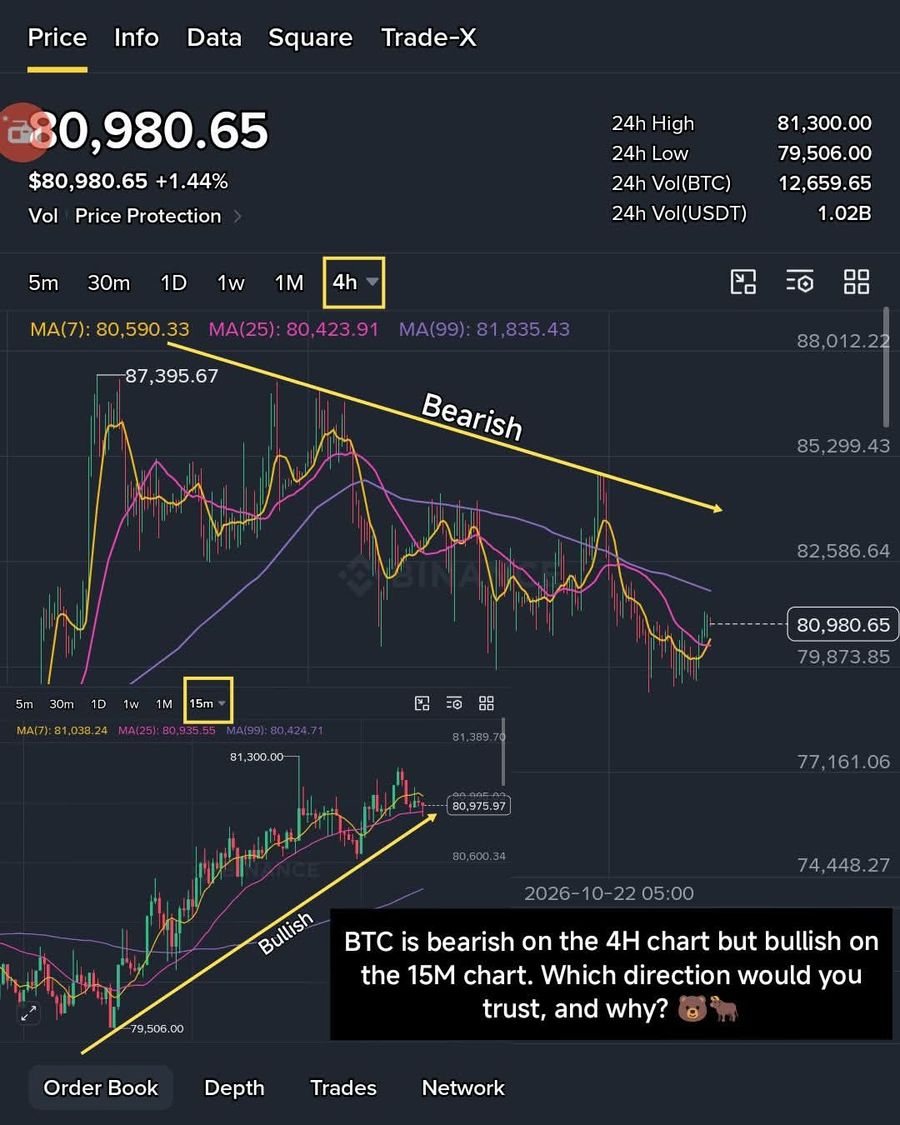
📊 BTC MARKET DEBATE: TWO TIMEFRAMES, TWO DIFFERENT STORIES! 😳📈
Bitcoin looks bearish on the 4H chart but bullish on the 15M chart. So, which direction deserves more attention?
🤔 Is the 15M bullish momentum an early sign of a reversal, or is BTC simply experiencing a short-term pullback within a larger downtrend?
Remember the 4H chart helps reveal the bigger market structure, while the 15M chart shows shorter-term price movements.
Note; Neither timeframe guarantees what happens next. Look for confirmation, manage your risk, and avoid making decisions based on a single signal.
👇 If you were analysing this chart, which timeframe would you trust more, and why? Share your reasoning in the comments!
#Bitcoin #BTC #CryptoEducation #TechnicalAnalysis #CryptoTrading
Comments