
Ethereum 4H Technical Analysis: ETH Consolidates Above SMA 20 Near $1,920
Ethereum is changing hands at $1,920.91 on Binance, registering a modest +0.22% move over the past 24 hours as price action remains contained within a narrow band. The session has traded between a low of $1,912.27 and a high of $1,926.72, supported by $128,471,776 in 24-hour volume. Market capitalization figures are currently unavailable, yet the tape still offers a clear short-term picture: ETH is holding above its 20-day simple moving average while momentum indicators stay balanced rather than extended.
That combination of a slight positive daily print, compressed range, and constructive placement relative to the moving average frames the present environment as one of cautious equilibrium. Recent network status reports continue to show stable block production times, active verification nodes, and normal transaction flow, providing a steady structural backdrop without directly dictating the next directional impulse on the chart.
Four-Hour Trend, Momentum, and Key Levels
On the 4-hour timeframe, Ethereum’s prevailing market trend remains lightly bullish insofar as spot price trades above the SMA 20 at $1,897.68, a configuration that historically favors buyers on orderly pullbacks. Price action itself has been range-bound and methodical, oscillating just beneath the immediate resistance shelf rather than trending impulsively. The 14-day RSI at 56.9 confirms a neutral momentum posture, neither stretched into overbought territory nor signaling exhaustion on the downside, which aligns with the limited 0.22% daily advance and the tight high-to-low spread.
Liquidity conditions appear sufficient given the reported volume, yet the absence of a decisive range expansion suggests that aggressive directional conviction is still missing. Buyers have defended dips toward the lower end of the session, while sellers have repeatedly capped advances near the upper boundary, leaving neither side with an uncontested advantage. Immediate technical structure is well defined: key support sits at $1,913.21, closely aligned with the 24-hour low, and immediate resistance stands at $1,927.66, just above the session high. Broader 30-day reference points extend from a historical low boundary of $1,737.68 to a historical high boundary of $1,981.24.
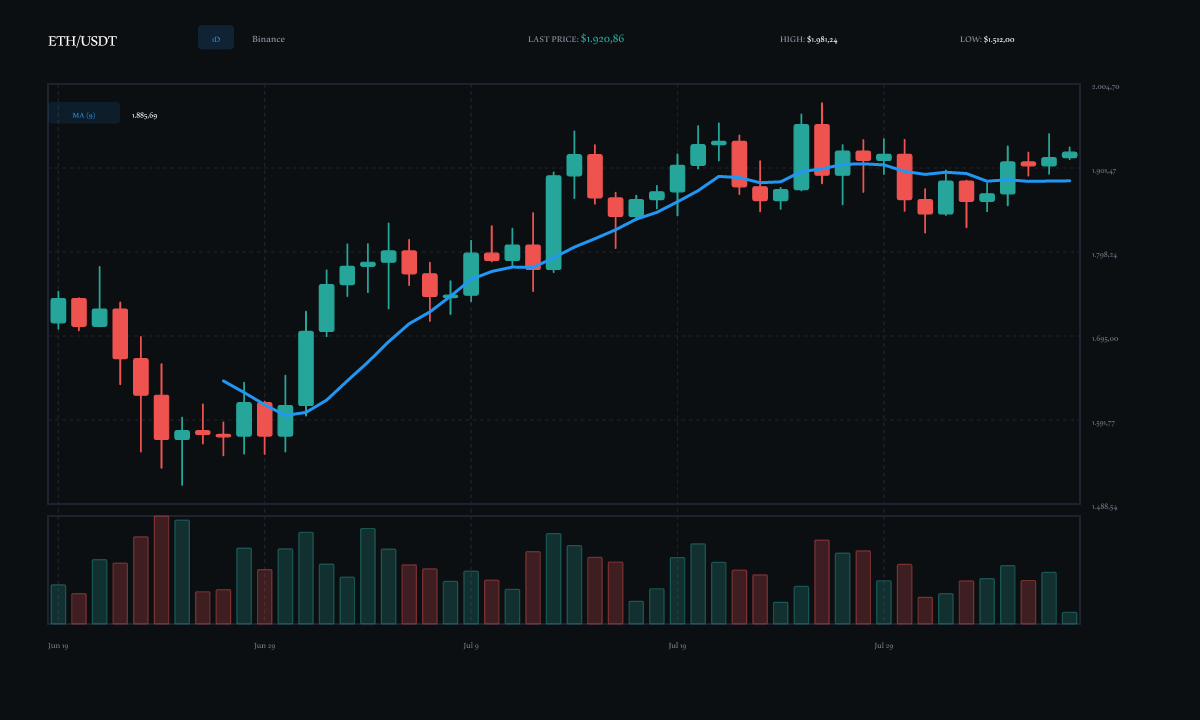
A confirmed breakout above $1,927.66 on the 4H chart, especially if accompanied by a clear expansion in participation, would indicate that buyers have absorbed overhead supply and regained short-term control. Such a development would be consistent with the already constructive placement above the SMA 20 and could open room toward the upper 30-day boundary near $1,981.24, while likely pushing RSI out of its neutral band into more constructive territory. In a fully developed bullish scenario, successive 4H closes above resistance would reframe the recent consolidation as a continuation base rather than a distribution area, shifting the advantage firmly to the demand side and inviting trend-following interest on subsequent pullbacks that hold the breakout level as new support.
A rejection from $1,927.66, by contrast, would keep Ethereum locked inside its current compression and raise the probability of a retest of $1,913.21. Failure to hold that support would hand the near-term advantage to sellers and direct attention toward the SMA 20 near $1,897.68 as the next meaningful cushion. In a bearish scenario, repeated failures at resistance combined with a drift lower in RSI would signal that supply is dominating the 4H auction, potentially extending the corrective phase until a fresh demand base forms closer to the moving average or deeper within the 30-day range. Until one of these boundary conditions is resolved, the market continues to reflect balanced two-way trade rather than a one-sided trend day.
Overall, the 4H outlook is defined by a constructive but unconfirmed bias: price holds above the SMA 20, momentum is neutral at an RSI of 56.9, and the decisive battleground remains the narrow corridor between $1,913.21 support and $1,927.66 resistance. Volatility has been subdued relative to the wider 30-day envelope, and order flow has not yet produced the volume signature required to validate either a breakout or a breakdown. Traders focused on this timeframe should therefore treat the next several 4H candles as information-rich events that will clarify whether the slight daily bid can convert into sustained upside follow-through or whether overhead supply will again force a rotation lower.
Ethereum’s 4H structure remains lightly bullish above the SMA 20 while constrained by nearby resistance, with $1,913.21 and $1,927.66 as the levels that matter most. The next 4H candle’s reaction at those boundaries, together with any shift in RSI or volume, will determine whether buyers or sellers seize the short-term advantage.
Comments