
Dogecoin 4H Technical Outlook: Neutral Momentum Caps Gains Near $0.07
Dogecoin is trading at $0.07 on Binance, registering a 24-hour gain of 1.56 percent after oscillating between a session low of $0.069 and a high of $0.07. The opening range remained tightly compressed, with buyers defending the lower boundary while sellers repeatedly capped upside attempts at the same $0.07 ceiling that now defines both the live price and the immediate technical boundaries. Twenty-four-hour trading volume stands at $25,357,903, a moderate figure that points to orderly participation rather than forced liquidation or speculative frenzy. Market capitalization data is currently unavailable, leaving price action and on-exchange liquidity as the primary reference points for assessing short-term conditions.
The narrow daily range and measured volume profile suggest a market in equilibrium. Neither aggressive accumulation nor sustained distribution is evident, and the modest positive close implies that dip-buying interest remains present without generating enough conviction to force a decisive breakout. Network-level reports continue to show stable block production times and normal transaction throughput, providing a constructive structural backdrop that has so far failed to translate into directional volatility on the charts.
Four-Hour Chart Structure and Scenario Mapping
On the four-hour timeframe Dogecoin is locked in a neutral trend. Price is positioned fractionally below the 20-day simple moving average at $0.07, confirming the absence of a clear directional bias and reinforcing the sideways character of recent candles. The 14-day relative strength index reads 49.8, sitting almost exactly at the midpoint and underscoring balanced momentum with no overbought or oversold extremes. Price action itself has been characterized by successive small-bodied candles and limited wicks, reflecting a standoff between buyers defending the $0.069–$0.07 zone and sellers defending the identical $0.07 resistance cluster. Immediate support and resistance therefore converge at $0.07, creating a pivot that will dictate the next measurable move. The 30-day historical range stretches from a low boundary of $0.07 to a high of $0.08, placing current trade at the lower end of that broader corridor and leaving overhead room only if buyers can first clear the local ceiling.
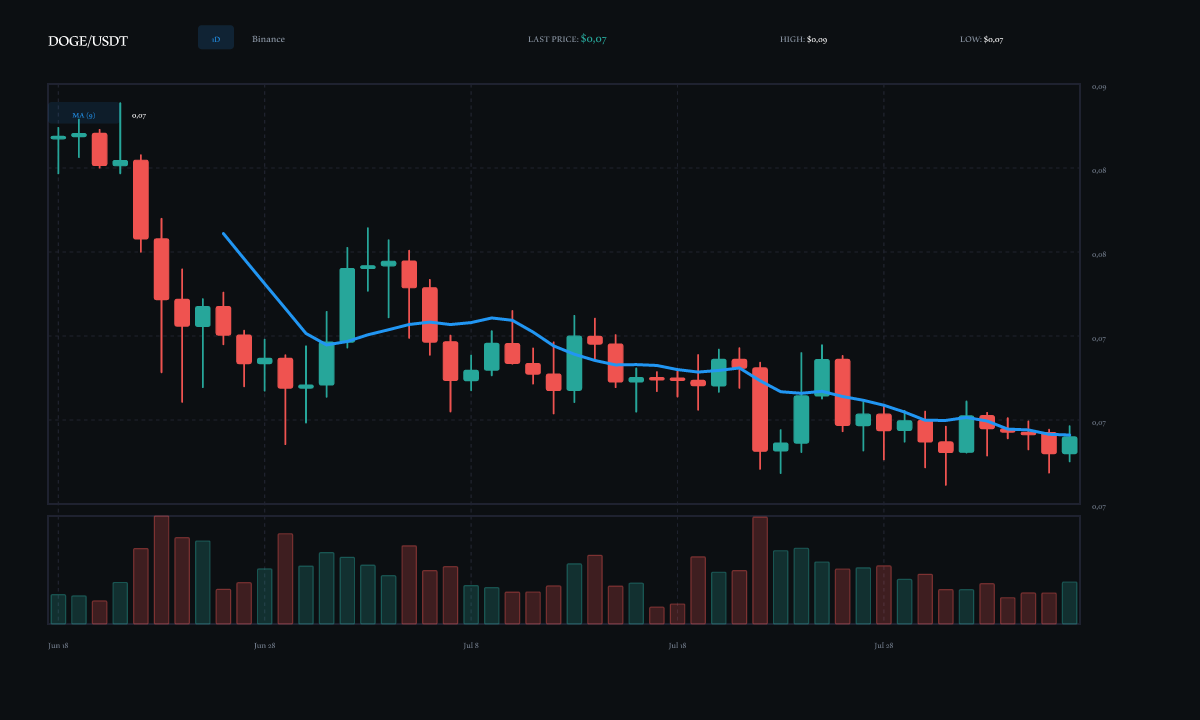
Liquidity conditions appear adequate for the prevailing volume, yet the compressed spread between support and resistance leaves little buffer for error. Buyer activity has been sufficient to absorb modest selling pressure and produce the 1.56 percent daily advance, but the failure to extend beyond $0.07 indicates that sellers retain tactical control at the highs. A confirmed four-hour close above the $0.07 resistance band would signal that buyers have seized the advantage, potentially opening a path toward the 30-day high near $0.08 and shifting the short-term structure from neutral to constructively bullish. Such a breakout would need to be accompanied by an expansion in volume and a sustained RSI move above 55 to confirm genuine momentum rather than a fleeting spike.
Conversely, a rejection from the $0.07 resistance level would reassert seller dominance and keep Dogecoin pinned inside its recent consolidation. In that bearish scenario, price would likely rotate back toward the $0.069 session low and test the integrity of the 30-day low boundary at $0.07. A decisive four-hour close beneath that floor would expose the market to further downside pressure, with momentum indicators then free to drift toward oversold territory and reinforce a short-term corrective phase. Until either breakout or breakdown is confirmed, the four-hour chart remains a balanced contest in which neither side holds a durable edge.
Traders monitoring the next four-hour candle should focus on whether price can secure acceptance above $0.07 on expanding volume or whether repeated failures at that level invite a rotation lower. The combination of a neutral RSI, price hovering beneath the 20-day moving average, and identical support-resistance levels at $0.07 defines a classic inflection zone. Whichever side forces a clean close beyond this pivot will likely dictate the tone of the subsequent sessions.
Dogecoin’s four-hour structure is neutral, with $0.07 serving as both the critical support and the immediate resistance that traders must watch. A sustained break of either side of this level, validated by volume and RSI confirmation, will establish the next directional leg.
Comments